At My Current Employer


At my current role, I’ve led several high-impact strategic initiatives-reducing device disablement by 12% through payment behavior analysis, increasing daily payment recovery by ~10% using data-driven call strategies, and improving targeting accuracy by 30% in partnership with the Data Science team.
I drove an 8% rise in repeat purchases and a 5% boost in customer lifetime value through a CEO-prioritized campaign, executed under tight timelines.
Additionally, I designed agentless workflows that cut operational costs by up to 11%, introduced new performance metrics, and ran A/B tests that increased ROI by 200% in call center operations.
My work has consistently informed executive decisions and was recognized with a Dedicated Service Award.

Visual

CEO Dashboard - Google Sheets

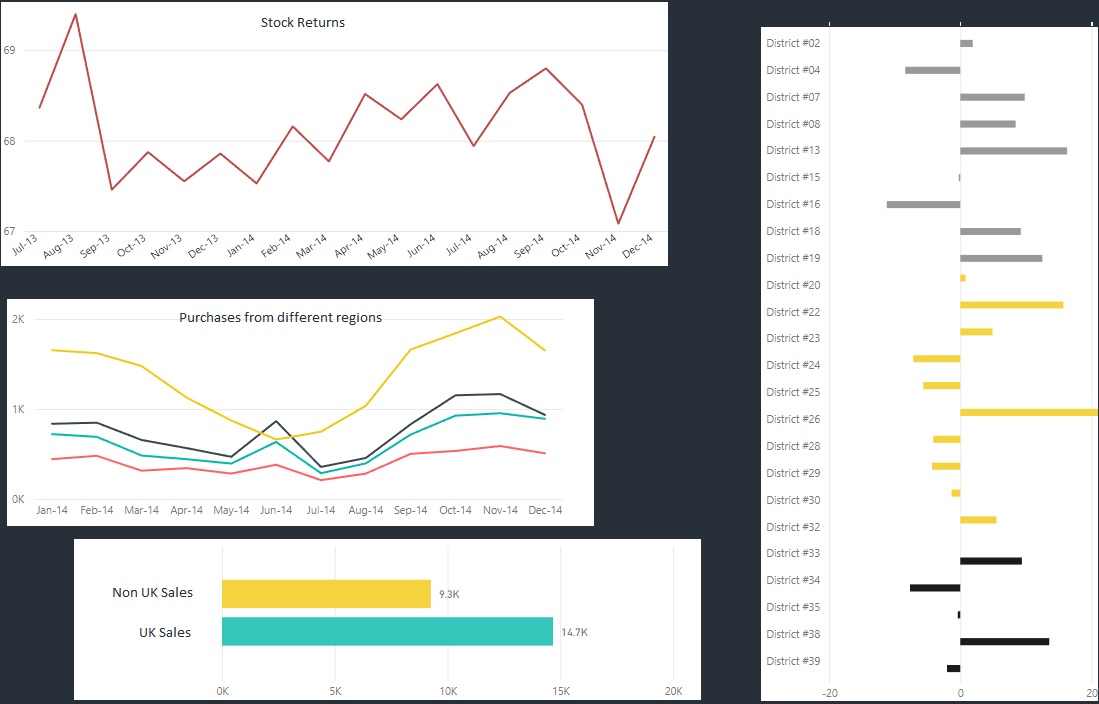
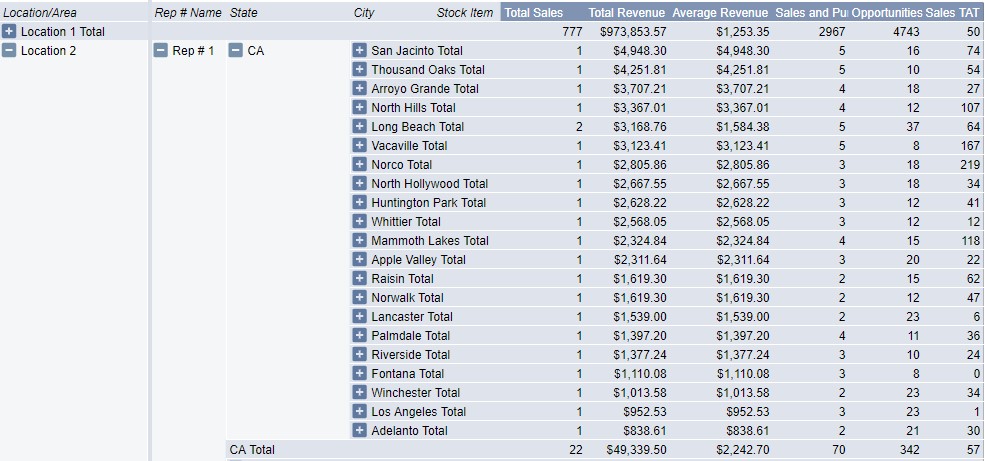
The snip has some visuals used on our CEO's Dashboard. This is our one stop shop.

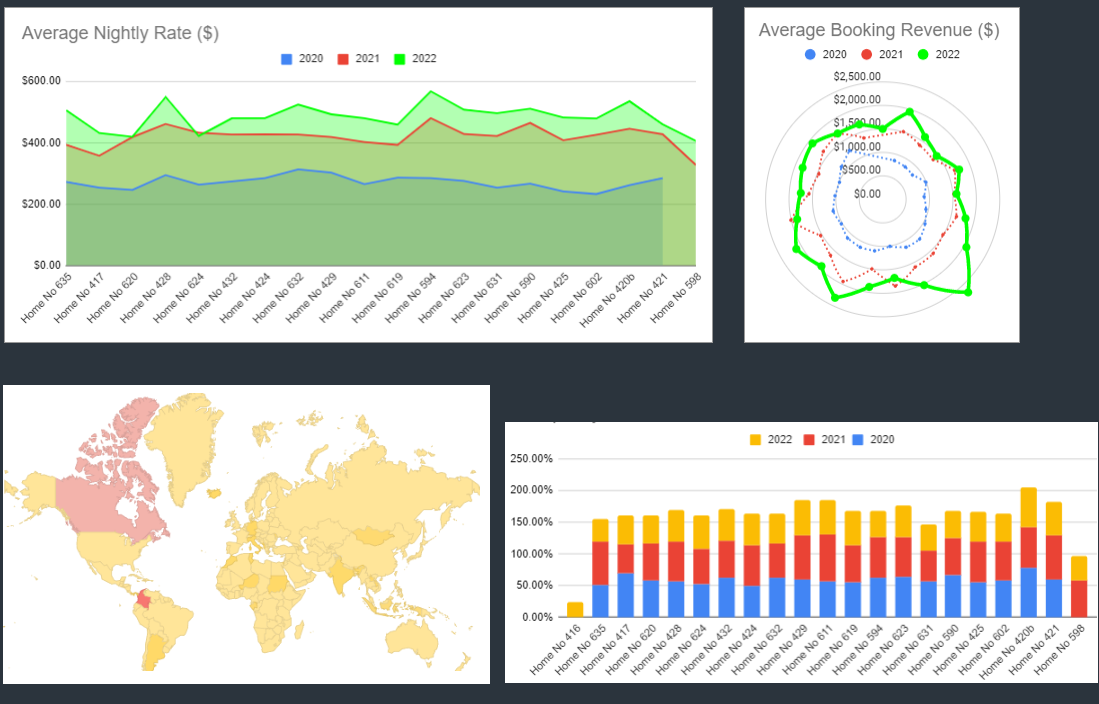
Our data originates from Streamline (VRMS), which lacks an external API connection, so we export it regularly for analysis. A single macro is used to cleanse and transform the data before refreshing the dashboards and visuals. The dashboard tracks 11+ key performance indicators, including Occupancy, Average Nightly Rate, Average Stay Length, and Revenue. It offers detailed insights by booking platform, location, agent, and guest composition—including age breakdowns for both children and adults. children and adults. It also provides a comprehensive view of our income and expenses.

Sales and Revenue - Power BI

One of our clients needed a Power BI dashboard integrated with their Sage ERP system to visualize Sales, Purchases, Stock, Nominal Ledger, and Net Revenue. Since Sage supported AAD-based Power BI integration, we connected the data and used Power Query for cleansing and transformation.

Key requirements included drill-downs for the Nominal Ledger (from Code to Department to Cost Centre) and dynamic filters that refreshed in real-time. As Sage didn’t directly flag invoiced transactions, we built custom logic using helper columns to isolate invoiced data only.

We also incorporated benchmarking by comparing their performance against similar organizations, using external data provided by the client in Excel.

Sales Dashboard - Excel

A client needed a low-cost solution to generate weekly Sales reports segmented by Sales Rep → Sales Region → Stock details, replacing a slow, formula-heavy setup. We built a dynamic Excel Pivot Table powered by a partially cleaned SQL view, with plans to expand into KPI tracking and visuals.

Interactive filters were added for time ranges (e.g., current month, year, last 3 years), along with a macro-enabled button that auto-filtered each Sales Rep’s data, generated individual files, saved them to the server, and emailed them directly—fully hardcoded to avoid license costs.

The client was impressed by Excel’s capabilities, and the project expanded as a result of the system’s speed, automation, and simplicity.

Employment Details

  • Sun king

    Senior Analyst (Data Intelligence)
    Oct 2023 - Present

    Focused on customer payment behavior analysis, call strategy design, and operational workflow optimization using Looker, Excel, and dashboards. Collaborated cross-functionally to build data-driven campaigns, streamline outreach processes, and improve internal reporting structures. Created performance metrics, led A/B testing, and shared insights with leadership to support strategic decisions.

  • ESVRM LLC

    Technology Specialist.
    July 2022 - March 2023

    Built interactive Google Sheets dashboards tracking 10+ KPIs like revenue, booking pace, and guest profiles, enabling 40% higher booking volume and faster CEO decisions. Introduced targeted pricing strategies based on guest demographics, boosting campaign accuracy by 15% and increasing average booking lead time by 9 days. Led a team of 4 for faster dashboard delivery and initiated operational runbooks to ensure continuity during team transitions.

  • Elan Tapes

    Data Analyst / Entrepreneur in Residence
    July 2018 – Jun 2022

    Created robust reports on Excel to analyze market trends, worked on KPIs to show the Income and Expenditure statements, negotiated and discussed with clients to understand business requirements and handle data issues.

  • Alight Solutions

    Customer Service Specialist
    July 2017 – August 2018

    Supervised and trained the team, helped clients with their health/benefits, payroll, and 401k contributions in the US, top performer throughout the year out of 33 team members, and one of the 3 team members trained in both clients and all departments.

  • KafeRoadtripling

    CEO and Co-Founder
    February 2016 – August 2017

    My Responsibilities included but were not limited to maintaining our ATVs, effective training, managing purchases, creating the website, managing the staff, organizing events and reaching out to people.

  • BhanTechTips

    Data Analyst
    February 2016 – March 2021

    Created a YouTube channel because I was fascinated with how much people liked to watch videos. Researching for trends/topics, understanding concepts, creating scripts, rehearsing, recording videos, editing and publishing was not an easy task but I tried my best to convey my message (knowledge is freely available and accessible, we need to look for the place not knowledge).